Contents
Custom Jupyter Widgets
The game widgets of cgt-py show one position and let us edit it, but they do not analyse it. They are meant to be composed with ipywidgets into small tools that recompute whatever we are interested in each time the position changes. In this guide we build two such tools.
Setup
We need cgt-py and Jupyter, which Installing cgt-py sets up. Every example below uses the following imports.
Game Widgets
Each game that can be edited graphically has a widget function, such as SnortWidget. It takes an optional starting position and returns a widget showing it.
=
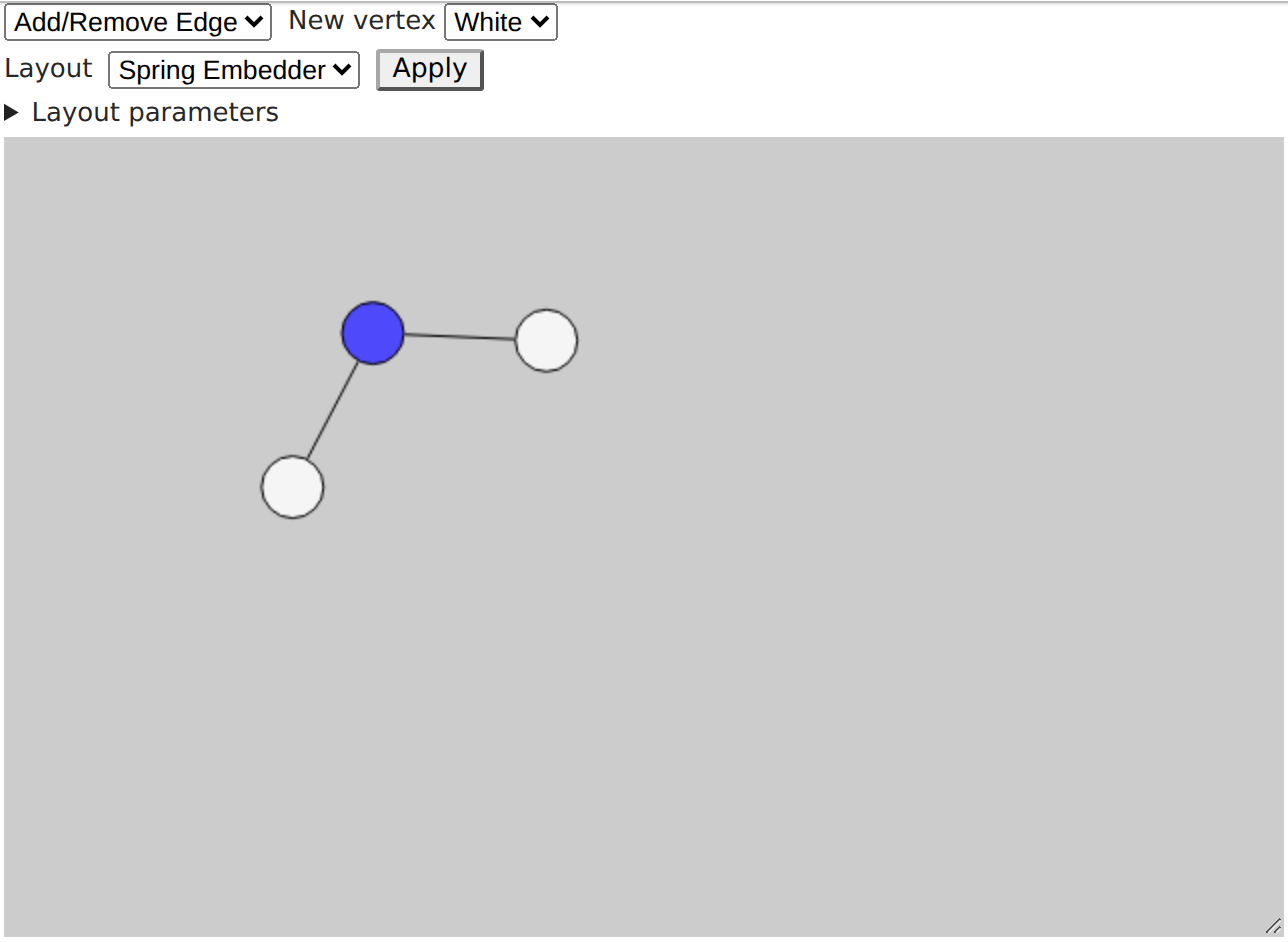
The menu above the board selects what a click does: adding or removing vertices and edges, moving vertices, or making a move for Left or Right.
The widget keeps the position in its graph attribute, a Graph, and .game reads it back as a Snort position. Printing a position shows the Python expression that creates it, which we can paste into a later cell or share with someone else.
=
Snort(3, [(0, 2), (1, 2)], blue=[2], red=[])
From here, the position works like any other cgt-py value.
CanonicalForm('{2|*}')The other games have widgets too. The games played on graphs keep their position in graph, and the games played on grids keep it in grid, a Grid.
| Widget | Position | Attribute |
|---|---|---|
SnortWidget | Snort | graph |
ColWidget | Col | graph |
BipartiteSnortWidget | BipartiteSnort | graph |
DigraphPlacementWidget | DigraphPlacement | graph |
DomineeringWidget | Domineering | grid |
FissionWidget | Fission | grid |
AmazonsWidget | Amazons | grid |
KonaneWidget | Konane | grid |
Reacting to Changes
To keep an analysis up to date, we register a callback with observe. It is called with a change whose new field holds the new Graph. The callback below prints into an Output widget, which we place next to the game widget with HBox.
=
=
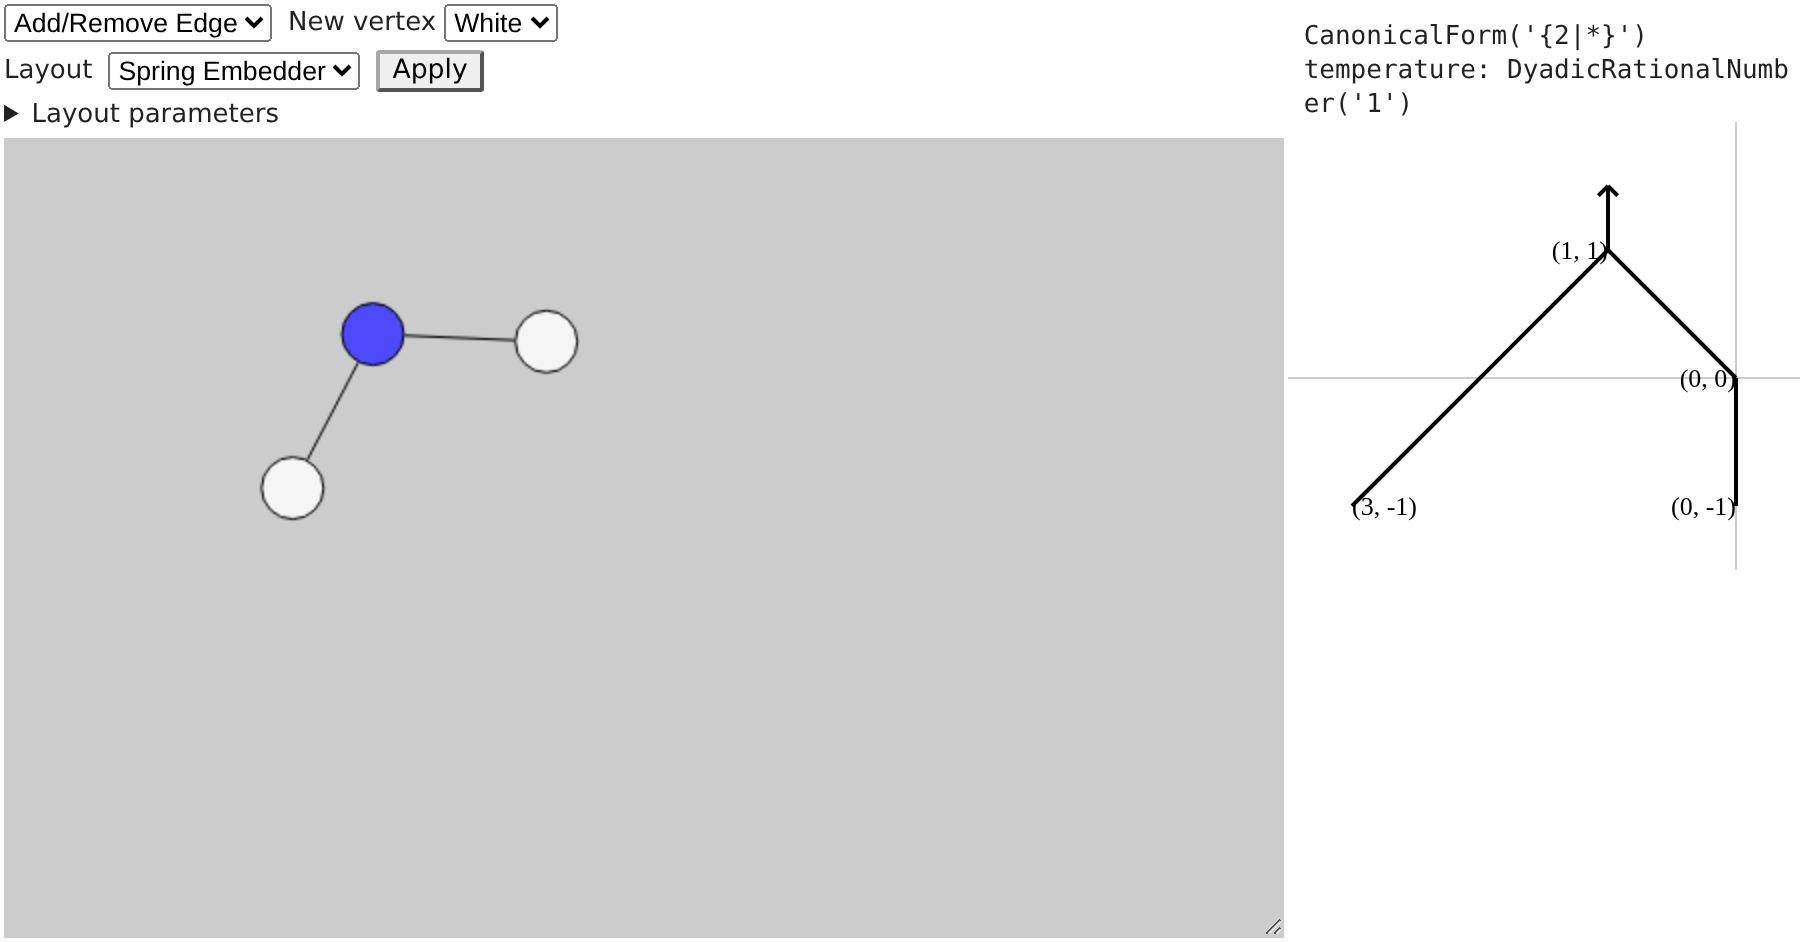
The callback also runs once when the widget is first shown, so the output is filled in before we make any edit. Both views of w, here and in the cell above, show the same position, and editing either of them updates the analysis.
We created the game widget in its own cell on purpose. That way we can change the callback and run its cell again without losing the position we have set up. Each run adds one more callback to w though, and the old ones keep computing in the background, so restarting the kernel once in a while keeps edits fast.
Grid Games
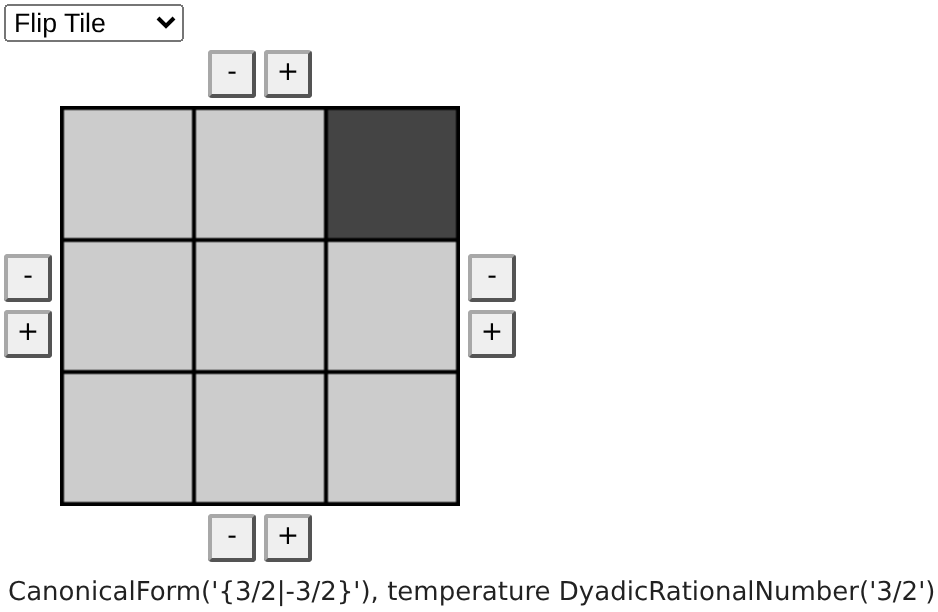
A callback does not have to print. Here it updates a Label placed under a Domineering board, observing grid instead of graph. The position is written row by row, with rows separated by |, . marking an empty square and # a filled one.
=
=
=
= f
Saving Notebooks
Jupyter saves the state of widgets only when asked to. In JupyterLab 4 and Notebook 7 we have to turn on Settings → Save Widget State Automatically, otherwise a reopened notebook shows "Error displaying widget: model not found" in place of each widget. Callbacks are never saved, so after reopening a notebook we run it again to make its widgets react to edits.